
Weekly Commitment Of Traders Report, As of April 8th, 2025

I’ve decided to separate my COT (Commitments of Traders) data analysis into its own weekly article. This way, readers who specifically want to track futures positioning can easily find the information without scrolling through my broader market recap.
Disclaimer
This content contains technical analysis and my own interpretations of the data. It is not intended as financial advice. Always consider your personal financial situation and do your own research before making any trading or investment decisions.
What Is the COT Report?
COT = Commitments of Traders: A weekly report published by the Commodity Futures Trading Commission (CFTC) every Friday afternoon.
It shows futures positioning in various asset classes (commodities, financials, currencies, etc.) as of the prior Tuesday’s market close.
Because it captures data from Tuesday and is published on Friday, it’s inherently lagging—by the time we see it, positioning shifts may already be reflected in price action. Nonetheless, the COT can still give important clues about extreme positioning, potential market turning points, and overall sentiment.
Why Follow It?
Identify Positioning Extremes:
When Non-Commercial traders (speculators) are heavily net long or net short, it might signal an overcrowded trade that’s vulnerable to a reversal.
Spot Emerging Trends:
Commercial participants are often hedgers with deeper knowledge of the underlying commodity’s supply/demand dynamics. Shifts in their positioning can sometimes foreshadow bigger price trend changes.
Gauge Sentiment:
The balance between Commercial (hedgers) and Non-Commercial (speculators, CTAs, funds) positions helps you see which side might be more convinced of a trend—or preparing to fade it.
My Journey with COT Data
I’ve been collecting and analyzing COT data since late 2024. I’m fairly new to this particular aspect of market analysis, but I’m improving each week. It’s been eye-opening to see how futures positioning aligns with price moves over time.
Here’s my current process:
Source: I pull the Futures-Only “Historical Compressed” files directly from the CFTC website.
Focus on Non-Commercial: I primarily track Non-Commercial (speculative) positions in an Excel model to see where speculators are piling in or bailing out.
Commercial vs. Non-Commercial: I also have a Python script that shows both categories side by side, since significant changes in Commercial (hedging) activity can signal major moves ahead.
Understanding Commercial vs. Non-Commercial
Commercial (hedgers): Often producers or end-users of the commodity. Their main goal is hedging price risk related to their business.
Non-Commercial (speculators, CTAs, funds): These are traders aiming to profit from price changes rather than hedging production. Their positioning can reveal market sentiment and willingness to take risk.
Why COT Alone Isn’t Enough
While the COT data is crucial for understanding who’s on which side of the trade, it’s still just one piece of the puzzle. In commodity trading, you also need:
Supply & Demand Fundamentals: Inventory levels, production rates, export data, weather conditions, etc.
Technical Analysis: Price patterns, momentum indicators, and other chart-based tools are heavily used by traders—large and small alike.
Lets dive in!
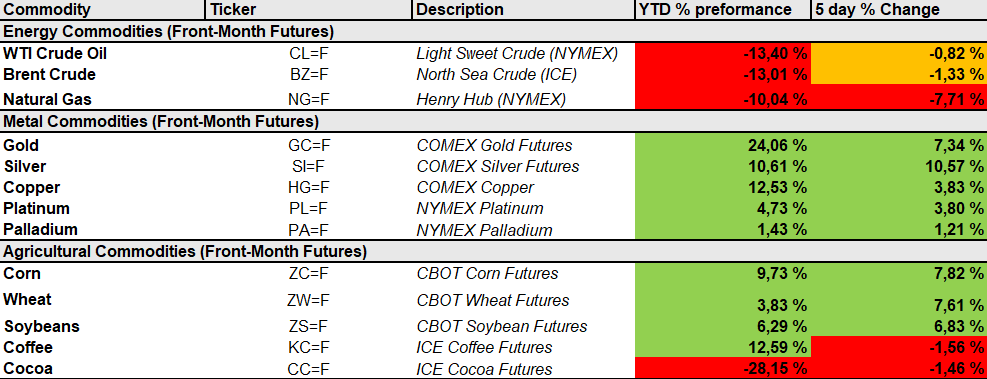
Commodity Market Performance this week
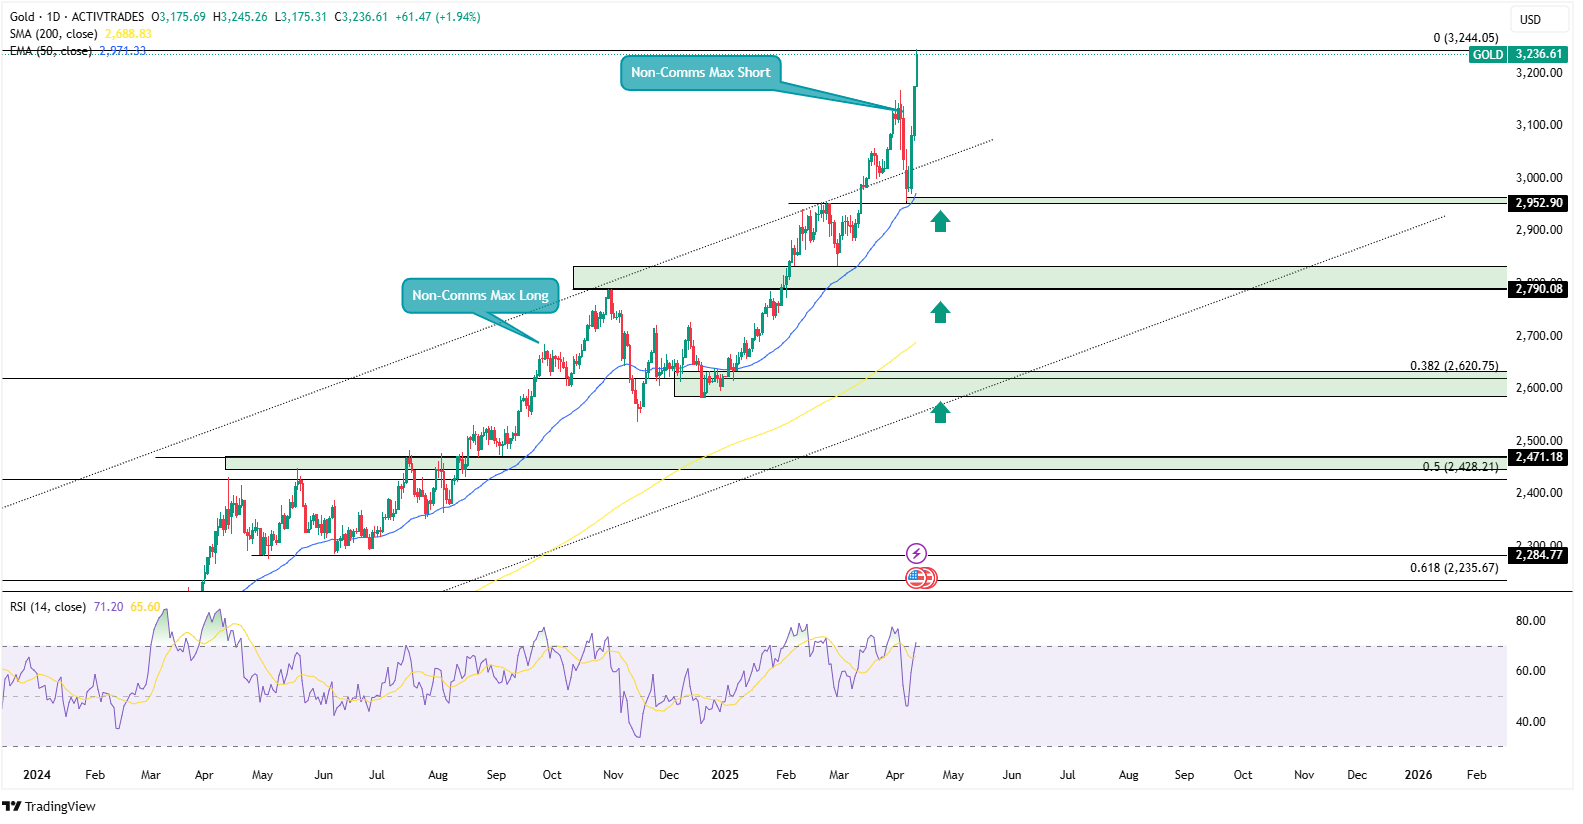
Gold
Gold was one of the clear winners in last week’s market volatility, surging roughly 9% since Wednesday. Interestingly, it had been in a minor correction phase from early April—something reflected in the COT data, where Non-Commercial traders (speculators) had ramped up their shorts to 89,502 contracts on April 1 (based on my year-to-date tracking starting January 2024). Essentially, the market was expecting more downside or at least a pause after this year’s strong rally, as gold has become quite popular among retail investors. The amount of both short and long positions have since then decreased with a major change in long positions from April 1 to April 8th, reflecting profit-taking.
I personally anticipated a deeper pullback—possibly a retest of the $2800-2,600 demand zones. However, last week’s parabolic move caught me off guard, meaning I missed a potential long swing entry. Gold’s sharp rally on Wednesday was so sudden that the previous COT snapshot (taken on Tuesday, April 8) still showed a decrease in Non-Commercial long positions, while shorts had already ticked down from their extremes.
Note: The COT data here reflects positions as of Tuesday each week. Last week’s major rally took place on Wednesday, so it’s likely that Non-Commercial long positions have since increased again—but we won’t see that reflected in the official report until next Friday. Price is now at New all time highs meaning its basically unclear where price will go. A Fibonacci Extension might give some context on possible levels.
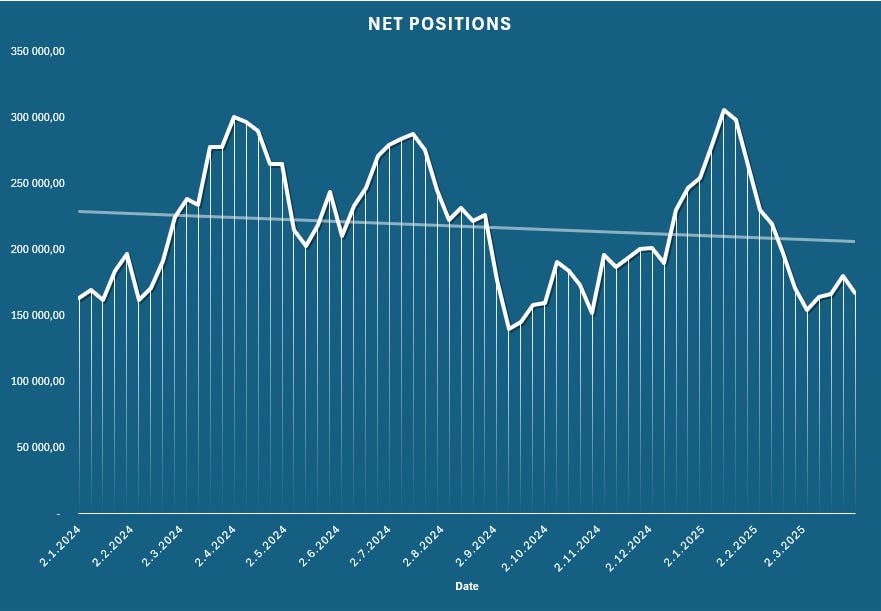
Quick Reference (Non-Comms Data Extract, Futures-Only):

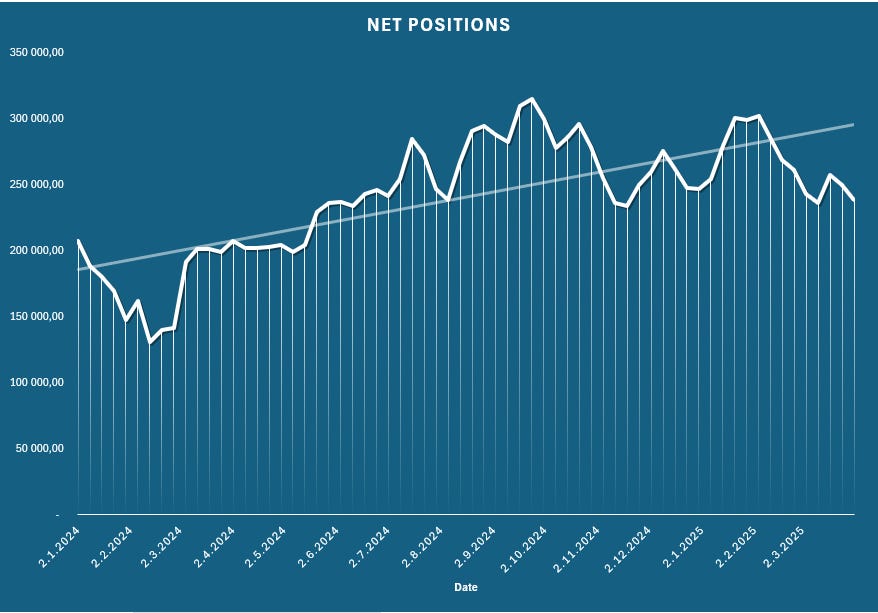
(Gold Net Positions)
Other Metals: Silver & Copper
Positioning shifts in Non-Commercial futures are also visible in other metals like Silver and Copper, albeit without the same drama we’ve seen in gold. This week’s COT data shows modest changes in both long and short positions, suggesting speculators are adjusting but not to the extent observed in gold.
However, the Silver/Gold relationship is historically relevant for gauging potential relative moves. When gold makes a strong rally, silver often follows (sometimes with a lag or a more volatile move). It’s possible that if gold’s momentum continues, silver could catch up in a more pronounced way
Non-Commercial positioning in Silver is as of Tuesday April 8: Net 46 516 contracts down from 57 258 on 1.4.2025
Non-Commercial positioning in Copper is as of Tuesday April 8: Net 24 241 contracts down from 30 025 on 1.4.2025.
Natural Gas (Henry Hub)
Positioning: As of last Tuesday, Non-Commercial traders remained predominantly net long, at 196,334 contracts. There hasn’t been any notable shift in these positions recently—speculators continue to show a generally bullish stance, but not aggressively so.
Price Action: Despite the net long interest, futures prices have been on a moderate decline, mirroring some of the broader risk-off sentiment across markets. Key support areas around $3.38 and $3.00 (on the chart) could become focal points if selling pressure persists.
Fundamentals & Weather:
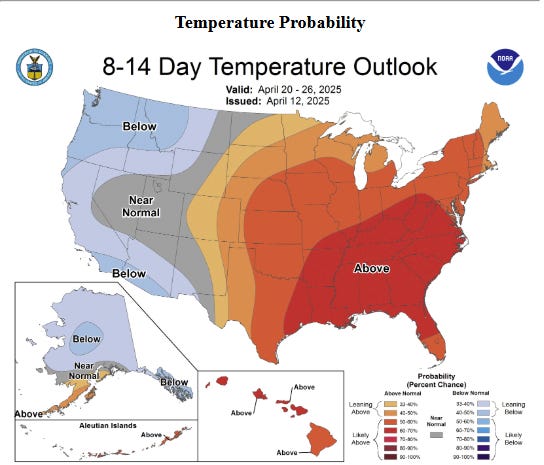
Temperature Outlook: The 8–14 day forecast suggests above-average temperatures for much of the eastern and central U.S., which could reduce heating demand in the short term.
Pipeline Maintenance: Permian Basin pipeline maintenance is currently limiting production somewhat, which can provide a mild supportive factor for prices if it continues.
LNG Feedgas Demand: Remains robust, contributing a steady baseline for natural gas demand even as residential/commercial usage may dip with warmer weather.
EIA Natural Gas Stocks Change
Actual: +57Bcf
Forecast: +60Bcf
Previous: +29Bcf
My Stance: “Wait and See”
With no dramatic COT shifts and mixed fundamentals (strong LNG demand vs. potential weather-driven demand drop), I’m taking a wait-and-see approach. If prices retest major support zones and positioning shifts more aggressively (either more net long or a flip to net short), that might offer a clearer signal for a potential trade. Until then, the market could remain choppy and sensitive to weather headlines or further supply disruptions.
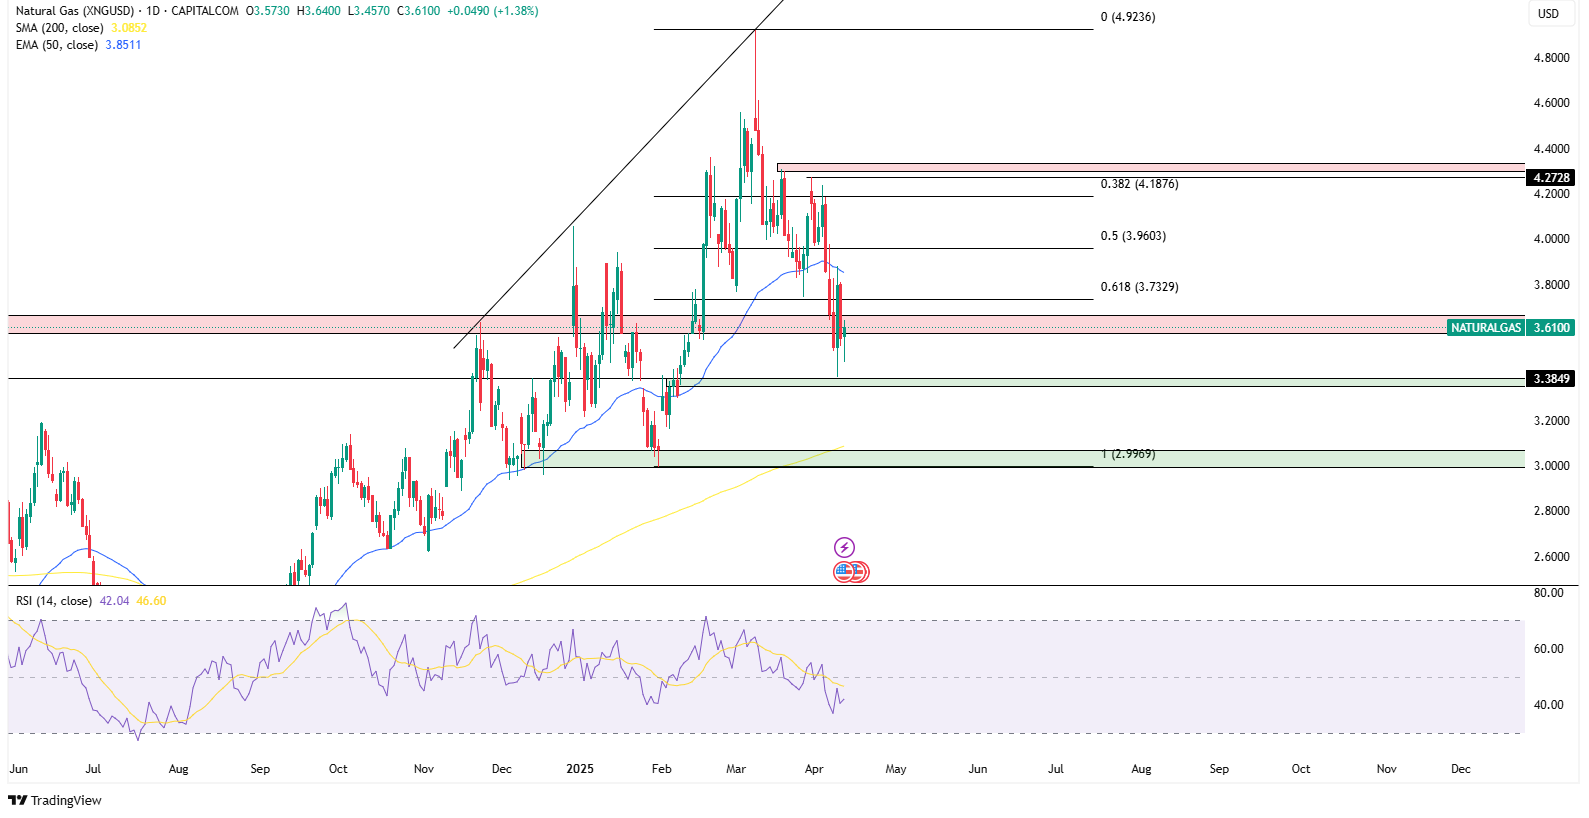
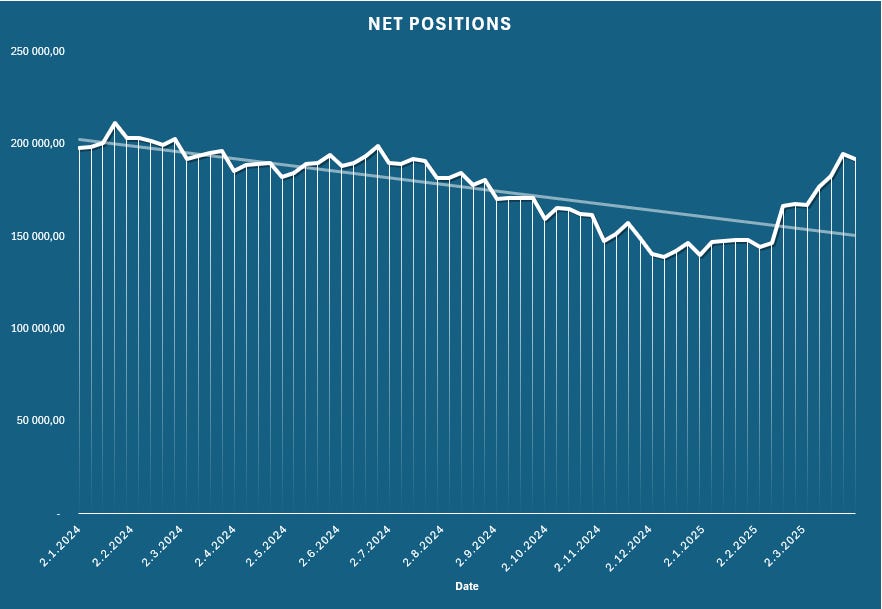
(Natural Gas, Henry Hub, Net Positions)
For an external perspective on natural gas market dynamics, you might want to check out ETF News on YouTube ETF. All credit goes to ETF News for their views on NatGas pricing and outlook.
Crude Oil (WTI)
Positioning (WTI):
Non-Commercials remain net long at 139,595 contracts, though there’s been a minor decrease in longs and a further increase in shorts, now at 177,693—the highest short count since January 2024.
This suggests growing skepticism or at least hedging activity among speculators, despite the market still being net long overall.
API Crude Oil Stock Change
Actual: -1.057M barrels
Previous: +6.037M barrels
Despite a drawdown in inventories, oil remains under pressure alongside broader market weakness.
EIA Cushing Crude Oil Stocks
Actual: +0.618M barrels
Previous: +2.373M barrels
Inventory gains continued at a slower pace but did little to lift prices.
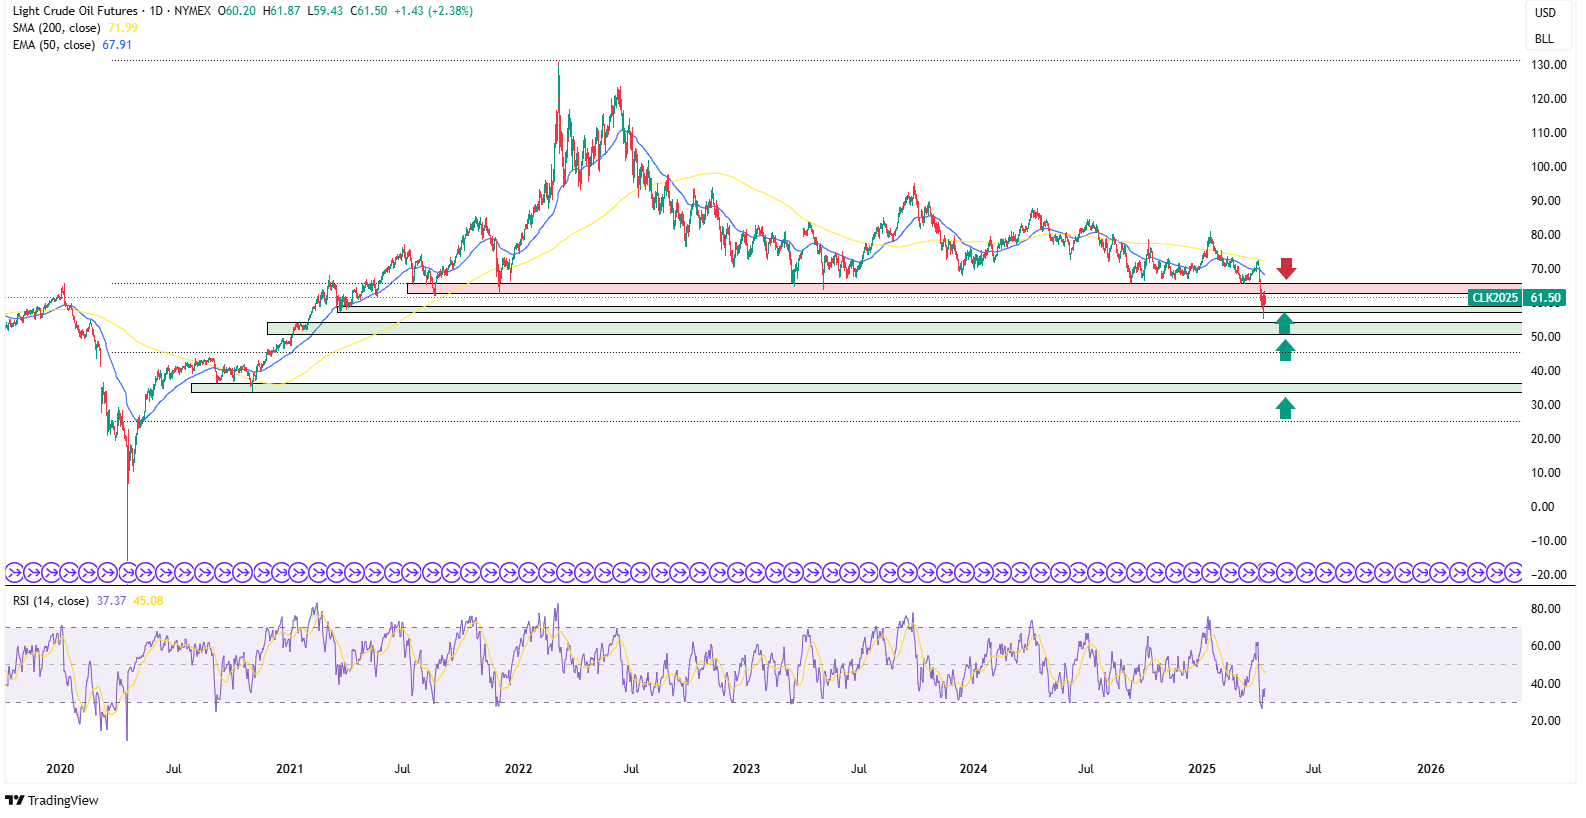
Price Action & Range-Bound Market:
After sizable declines earlier this year, WTI and Brent have traded in a range-bound pattern, reflecting a shaky macro backdrop with ongoing demand fears and ample supply from OPEC+ nations ramping production.
Concerns are emerging over the “destructive nature” of prolonged low oil prices—particularly the risk of under-investment if producers can’t maintain profitable levels.
Demand Outlook & Contrarian Play:
With global growth uncertain and talk of a possible economic slowdown, crude demand remains a wildcard.
Contrarian Approach: I personally initiated a small long position on Thursday, looking for a swing bounce with a tight stop loss—mainly due to risk/reward considerations at current price levels. (Remember, this is not financial advice, just my own trading decision.)
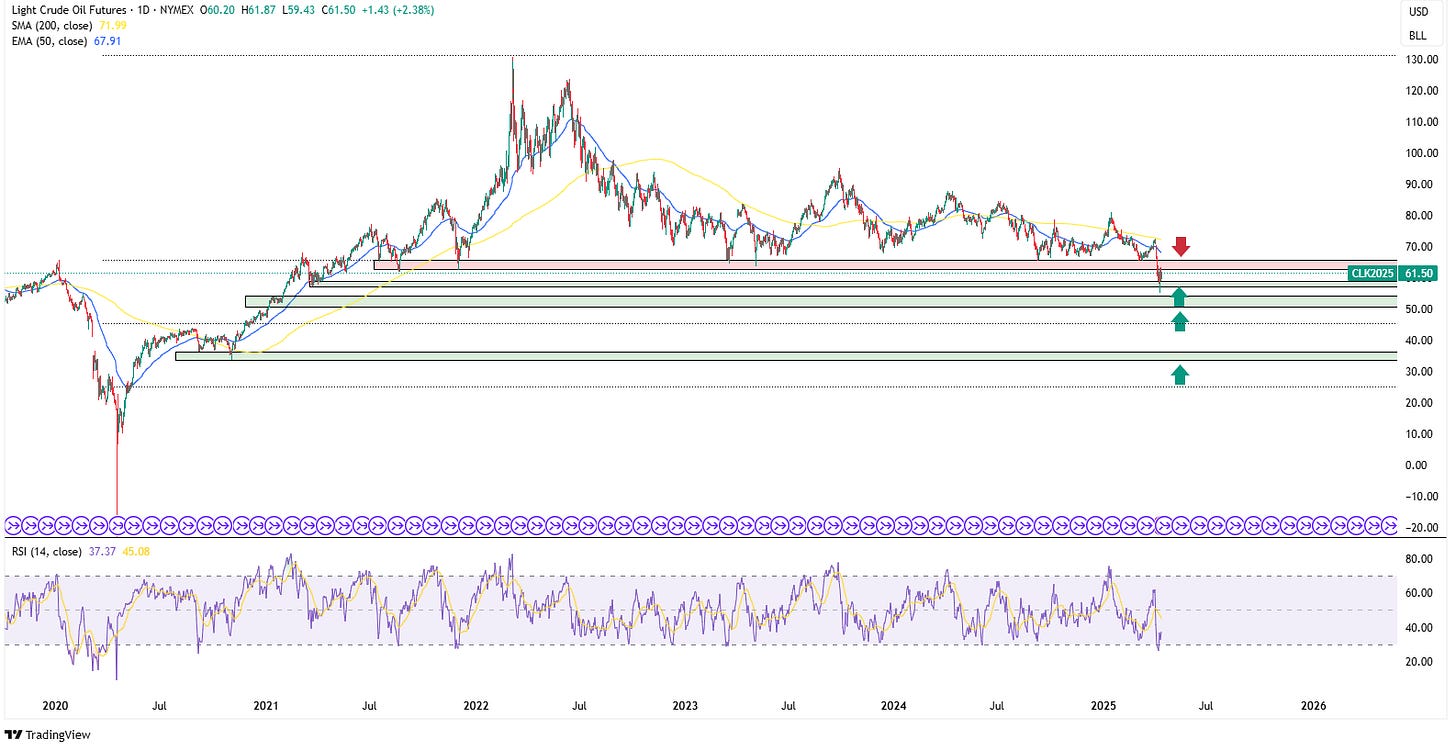

(WTI-Physical, Net Positions)
Other Highlights (Index & Fixed Income Futures)
UST 10Y Note: A massive decrease in Non-Commercial longs and a jump in shorts leaves net positioning at −1,078,470 contracts. This points to a continued bearish tilt on US Treasuries.
VIX Futures: Relatively unchanged, with a net position at −13,973 contracts, suggesting a somewhat neutral stance on volatility for the time being. (VIX down from 70 to 37)
E-mini S&P 500: Small increase in both longs and shorts, net sitting at +28,687. Speculators remain cautiously bullish overall.
Mini Nasdaq: Similar story, net +24,264, indicating a moderate risk-on tilt.
Russell E-mini: Net −12,745, leaning short.
Bitcoin Futures: Essentially flat at a net +1,332 contracts, indicating no major speculative shift in the crypto space within the reporting period.
These positions may have evolved after recent market turbulence, so next week’s COT data will reveal whether traders doubled down or pivoted following the latest moves.
Final Wrap-Up
Tracking the Commitments of Traders data gives us a unique look at market sentiment and positioning each week. While the report lags real-time price action, it can still highlight potential turning points and confirm (or contradict) what we see on the charts.
Ultimately, COT data is just one piece of the puzzle. Combining it with fundamental drivers (supply/demand, macro news) and technical signals (support/resistance, momentum) can give you a more complete picture of potential opportunities and risks. I’ll be keeping a close eye on next week’s release to see how positions evolve following the past week’s volatility—and I’ll share my observations as they unfold.
Thanks for reading. If you have any questions or feedback, I’d love to hear from you. Good luck with your trading or investing, and let’s see what the next report brings!
For more information on COT data visit CFTC and check out Briese, Stephen. The Commitments of Traders Bible : How to Profit from Insider Market Intelligence, John Wiley & Sons, Incorporated, 2008
This recap represents my own evolving analysis as an investor and student of the markets. Writing and sharing this content is a way for me to practice the same kind of thinking and communication I hope to bring into a future role as a financial analyst.
This report is essentially my personal market notebook — the key data, positioning, sentiment, and macro events I track each week — now shared publicly in case it’s helpful to others on a similar journey.
⚠️ Disclaimer: This content is for informational and educational purposes only and does not constitute financial advice. All views expressed are my own and based on publicly available data, my own research, and personal interpretation. I personally collect and interpret all data, but I use AI-driven writing tools for structural assistance and efficiency. Markets involve risk and uncertainty.
🗣️ I’m always looking to improve.
If you noticed something I missed, mistakes, have feedback, or just want to connect — I’d love to hear from you. Feel free to reach out to me on LinkedInThanks for reading.
Let’s see what next week brings.